Week 2 - Visualizing data
Data visualization and interpretation of graphical information 📊
 Berries. Photo by William Felker on Unsplash
Tasks
- Complete the readings
- Complete the assignments
Topic Intros
No. |
Title |
Slides |
|---|---|---|
| 01 | Visualizing data with ggplot2 | |
| 02 | Visualizing numerical data | |
| 03 | Visualizing categorical data |
Class Activities
Activity |
Title |
Date |
|---|---|---|
| Topic Intro | Data Visualization | Tue, 24 Sep |
| Topic Intro | Data Visualization | Wed, 25 Sep |
| Lab 02 | Plastic waste | Fri, 27 Sep |
Assignments
Assignment |
Title |
Due |
|---|---|---|
| Due this week | ||
| R 01 | Data Science By Whom? | Mon, 23 Sep, 23:59 EST |
| Lab 01 | Hello DCS! | Thu, 26 Sep, 23:59 EST |
| HW 01 | Pet names | Fri, 27 Sep, 23:59 EST |
| Q 01 | Visualizing Data | Sun, 29 Sep, 23:59 EST |
| Due next week | ||
| Lab 02 | Plastic waste | Thu, 3 Oct, 23:59 EST |
| HW 02 | Airbnb Listings Edinburgh | Fri, 4 Oct, 23:59 EST |
| Q 02 | Data wrangling | Sun, 6 Oct, 23:59 EST |
If you’re having difficulty accessing your HW or Lab repo, see troubleshooting advice here.
Readings
| 📖 | R4DS::Chp 3 - Data visualisation | Required |
| 📖 | IMS::Chp 4 and 5 - Exploring Categorical Data and Numerical Data | Required |
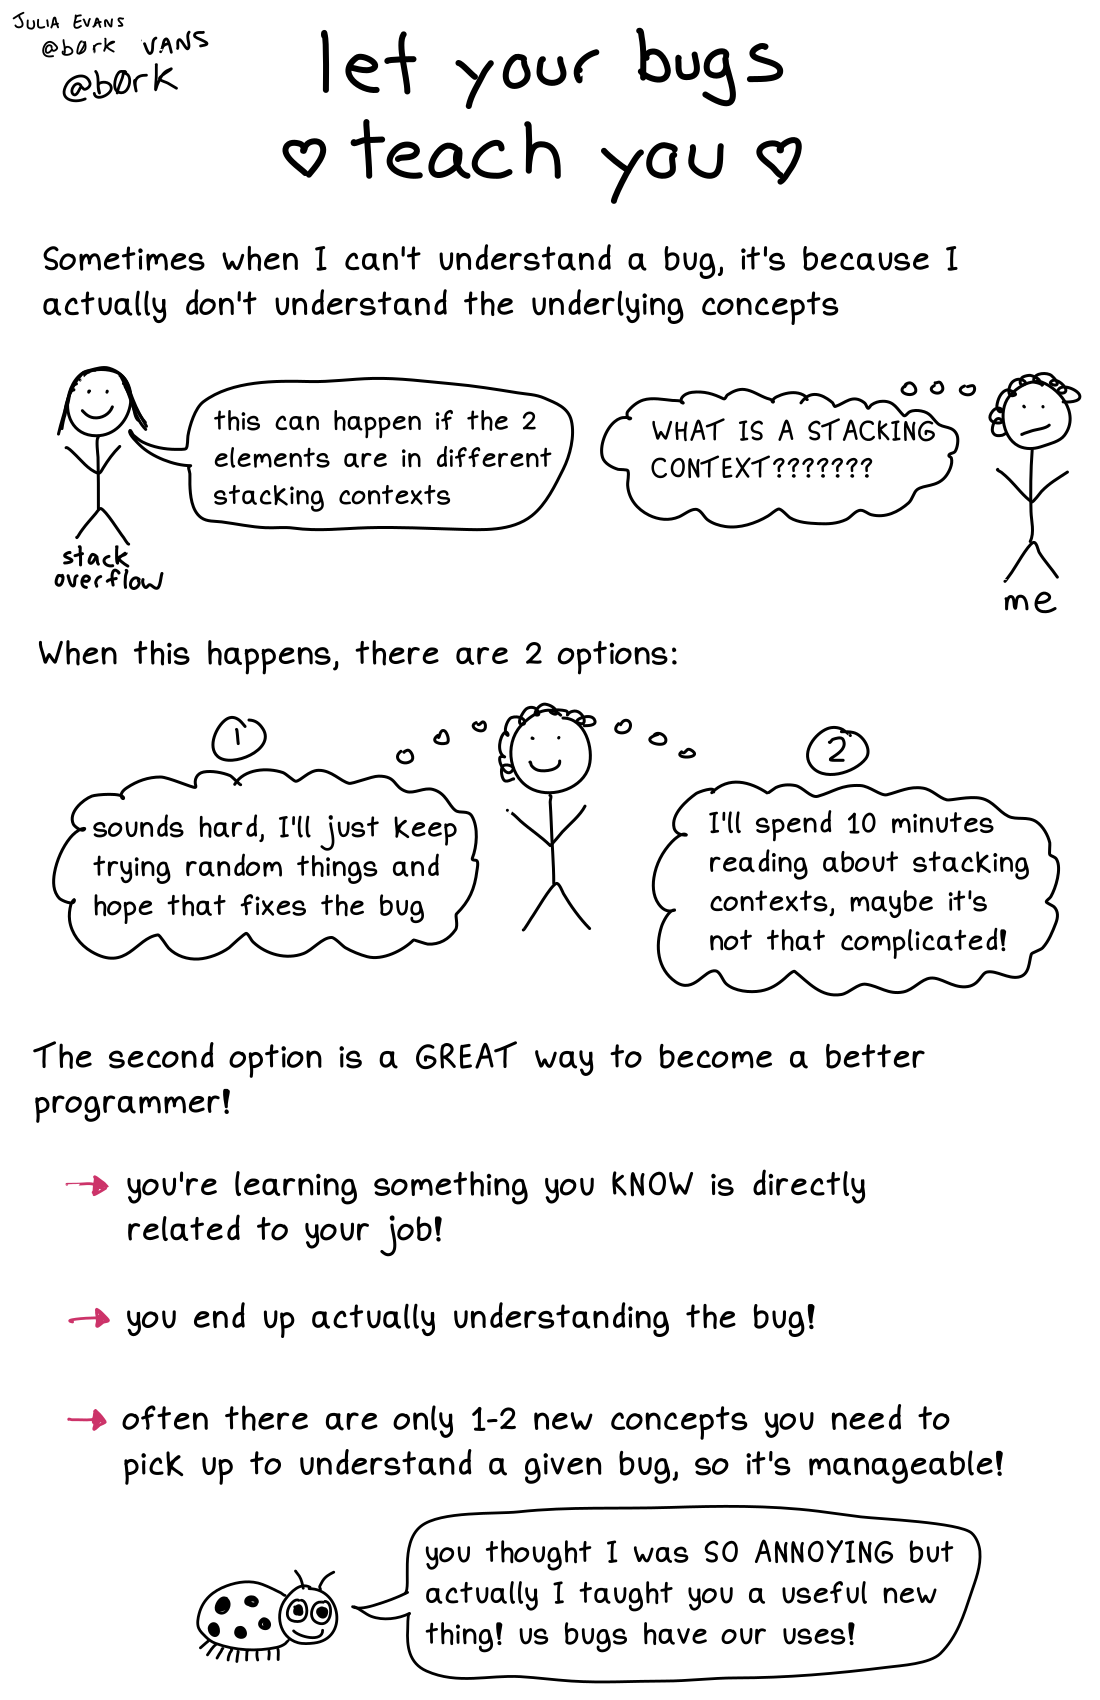
| 📌 | Debugging Tip: Bugs Teach You by Julia Evans | Optional |
| 📄 | Make a plot | Optional |
| 📊 | ggplot2 FAQs | Optional |
| 📄 | How to read an R help page | Optional |
| 📄 | rOpenSci’s Reproducibility Guide | Optional |
Interactive R tutorials
The following are interactive R tutorials, designed to give you more practice with R. These are optional, but the “Airbnb listings in Edinburgh” dataset show up in your next homework assignment as well, so you might want to go through that one so that you can gain familiarity with it. If you’re struggling with any of the topics covered this week, I strongly recommend you work through the second tutorial as well.
| Airbnb listings in Edinburgh | Related to HW 02 |
| Data Visualization Basics* | Extra practice |
*N.B. The rstudio primers are no longer being maintained but I am hoping to find some alternatives to give you practice.